Open Access
 Abstract
Introduction: Recently reported data have suggested that only a small subset of cancer cells possess the capability to initiate malignancies. These observations were based on investigation of cells within the primary tumors displaying a distinct surface marker pattern. CD133 marker is a putative hematopoietic and neuronal stem cell marker, which is also considered to be a tumorigenic marker in brain, prostate and liver. Recent studies have shown that a small population of CD133-positive cells, indeed, exists in human hepatocellular carcinoma (HCC) cell lines and primary HCC tissues. This study was aimed at isolating the cancer stem-like cells from hepatocellular carcinoma cell line HepG2 using three different methods: magnetic-activated cell sorting (MACS), spheroid culture (SC), and anti-tumor drug (ATD) resistant selection.
Methods: HepG2 hepatocellular carcinoma cells were expanded to yield enough cells that could be used to isolate cancer stem-like cells by these three methods. For MACS, cancer stem-like cells were sorted using anti-CD133 monoclonal antibody. For the second method, cancer stem-like cells were enriched by selection of anti-tumor drug resistance property. Lastly, for the third method, three-dimensional (3D) culture was used to enrich for the cancer stem-like cells. The cells obtained by the three methods were expanded to obtain an adequate number of cells for confirmation of CD133 expression.
Results: The expression of CD133+ cells in the three methods was found to be different. In the MACS method, the expanded CD133+ sorted cells cultured through 2 passages only contained 0.40 % CD133+ cells. In the 3D spheroid cell culture, of the population of cells there were 38.39 % that were CD133+ cells. Lastly, in the anti-tumor drug (doxorubicin at 150 nM) resistant selection, 66.22 % were CD133+ cells.
Conclusion: This study shows that isolation of HepG2 derived CD133+ population by culture with doxorubicin (150 nM) yields the highest efficiency and purity of the 3 methods studied.
INTRODUCTION
Stem cells are characterized by their ability to renew and differentiate into other cells in the body. Adult stem cells play an important role in tissue repair 1 . Recent studies have shown that there is a population of stem cells in human solid tumors including breast cancer 2 and brain cancer 3 . In addition, subsequent reports have identified stem cell populations in a range of tumors, such as colon, pancreatic, lung, prostate and glioblastoma tumors. These cells are called cancer stem cells (CSCs), and they carry the characteristics of both of cancer cells and stem cells. In addition to the ability to self-renew and differentiate, CSCs also have the ability to increase the production of new tumors. CSCs can be differentiated from other cells in the tumors through the way they divide and the variation in their gene expression 4 .
Cancer stem cells are a rare tumor cell population capable of forming and maintaining tumors. The three distinguishing features of CSCs include: (1) the ability to proliferate and form new tumors, (2) self-renewal, and (3) the ability to differentiate into other cell types 5 . In cancer research, the identification and isolation of CSCs are done via the identification of surface marker expression. Based on modern methods, such as immunohistochemistry and flow cytometry (FCM) analysis, CSC identification is fairly quick and feasible.
The expression of cell surface markers, such as CD44, CD24, CD29, CD133, tissue specific antigens (ESA), and aldehyde dehydrogenase 1 (ALDH1), were used to isolate and enrich CSC populations from various tumors 3 , 6 , 2 . However, recent research studies have shown that the expression of CSC surface markers is specific to each tissue type and even specific to each tumor. For example, CD44 + CD44 -/low expression and ALDH + expression are specific to breast cancer stem cells; CD133 + expression is typical for CSCs of brain, lung, liver and colon; CD44 + expression is typical for CSCs of head and neck; additionally, CD44 + , CD24 + and ESA + expression are typical for pancreatic CSCs 7 .
Several studies have recorded CD133 expression on the surface of CSC cells in liver cancer. According to a 2006 study, the CD133 + population in Huh-7 cells has a strong ability to proliferate in in vitro culture and the ability to form tumors when injected into NOD/SCID mice 8 . Along with the CSC hypothesis, many studies have also shown that the CD133 + cell population is resistant to chemotherapy and radiotherapy 9 . Many molecular mechanisms have been studied to understand the mechanisms of CD133 + CSCs in liver cancer and how to use them to avoid conventional therapies. Similarly, Dinh et al. demonstrated that CD133 + liver cancer cells were resistant to transforming growth factor beta (TGF)-β-induced apoptosis 10 . In addition, recent studies have shown that CD133 also has an impact on the ability of cells to invade and metastasize in liver cancer 11 .
In recent years, many studies on isolating and enriching cancer stem cell populations- based on CD133 marker expression- have been effective and demonstrated high purity; this is important for studies on tumor progression as well as studies of new cancer treatments. The research of D.D. Fang et al. (2010) demonstrated successful isolation of CD133 + cell population in primary colorectal tumors. Cells after isolation were able to produce spheroids and maintain CD133 expression 12 . A study by Xia Sheng et al. (2012) isolated and enriched populations of PC-3 cells (prostate cancer stem cells) through magnetic-activated cell sorting (MACS), and culture in serum-free medium (SFM). PC-3 cells after isolation had high expression of CD133 and CD44 13 . In addition, in 2017, Jue Wang et al . isolated the cell populations expressing CD133 - CD44 - , CD133 - CD44 + , CD133 + CD44 - , and CD133 + CD44 + from two lines of laryngeal carcinoma (Hep2 and TU -177) by MACS method; cells expressing CD133 + CD44 + were shown to have a higher probability of survival, metastasis, invasion and new tumor formation than the other populations 14 .
To date, many studies on cancer treatment have been conducted and have yielded some positive results. Currently, cancer patients can be treated with many methods, such as surgery, chemotherapy, radiation therapy, and/or a combination of different treatments to destroy the cancer cells. However, following treatment with chemotherapy and radiotherapy for some time, tumors may recur again and be more malignant than before. To overcome this problem, a study led by Ho Huu Duc (2018) focused on the isolation and identification of cells positive for CD133 and Epcam markers from colorectal gland tumors of NOD/SCID mice by means of flow analysis. They found these two colorectal cancer cell populations could grow robustly in in vitro culture conditions 15 . In this study, we aimed to isolate cancer stem-like cells, from HepG2 cells, and study their CD133 expression by 3 different methods: magnetic-activated cell sorting, spheroid culture, and anti-tumor drug-resistant selection.
Material and Methods
Cell culture
HepG2 cells were obtained from ATCC (Manassas, VA, USA) and were cultured in DMEM/F12 medium (Thermo Fisher Scientific, Waltham, MA) containing 10% fetal bovine serum (FBS) and 5% antibiotic (Gibco, Thermo Fisher Scientific, MA). HepG2 cells were cultured at 5% CO 2 humidified atmosphere at 37 o C. Cells were passed at 80% confluency by trypsin/EDTA (0.025%).
Anti-tumor drug-resistant selection
HepG2 cells were seeded on 96-well E-plate at a density of 2000 cells/well (100 µl). Cells were cultured at 37 0 C, 5% CO 2 for 24 hours. After 24 hours of culture, cells were treated with doxorubicin (Sigma-Aldrich, St. Louis, MO) at the following concentrations: 600 nM, 300 nM, 150 nM, 37 nM, 18 nM, 7 nM, and 0 nM (untreated control). The E-plate was placed in the culture cupboard of the xCELLigence system (ACEA Biosciences, San Diego, CA) culture for 96 hours. Based on the results of resistance, the cells that were resistant to doxorubicin were then selected to evaluate for expression of CD133.
Magnetic-activated cell sorting
HepG2 cells were mixed with CD133 microbeads (Mitenyi Biotec, CA) at a ratio of 16 µl cell suspension to 16 µl CD133 microbeads, and then mixed well. The mixture was incubated at 4°C for 15 minutes, with minimal light exposure, and shook well every 5 minutes during the incubation. Then, the cell suspension was centrifuged at 100 g, at 22°C for 5 minutes. The cell pellet was collected and then resuspended in 2 ml of cold PBS buffer. The cell suspension was loaded onto the magnetic column. The CD133 - cells would theoretically pass through the column while the CD133 + cells would be caught on the column. Finally, trapped cells were pushed out of column into a 15 mL centrifuge tube. The cells were expanded in the same condition to obtain enough cells for further evaluation.
Spheroid cell culture
In brief, 5000 cells/50µl were seeded in a well of a hanging drop plate (3D Biomatrix, Tampa, FL). The plate was then placed in an incubator at 37 0 C, 5% CO 2 for 3 days. All spheroids were collected into a centrifuge tube. The spheroids were washed twice by PBS. Then, the spheroids were suspended in 2 mL of PBS and vortexed to break the spheroids up into single cells. These single cells were used in further experiments.
CD133 expression analysis
In brief, the collected cells from the three methods were stained with 3 µL CD133 (AC133, Mitenyi Biotec, CA) antibody in 500 µl of binding buffer for 15 min. Then, the cells were washed with PBS to remove the antibody. Cells were analyzed using a FACSCalibur Flow Cytometer (BD Biosciences, Franklin Lakes, NJ). The data was analyzed statistically by GraphPad Prism 7 software (GraphPad Software, La Jolla, CA).
Results
Isolation of CD133+ HepG2 cells by MACS
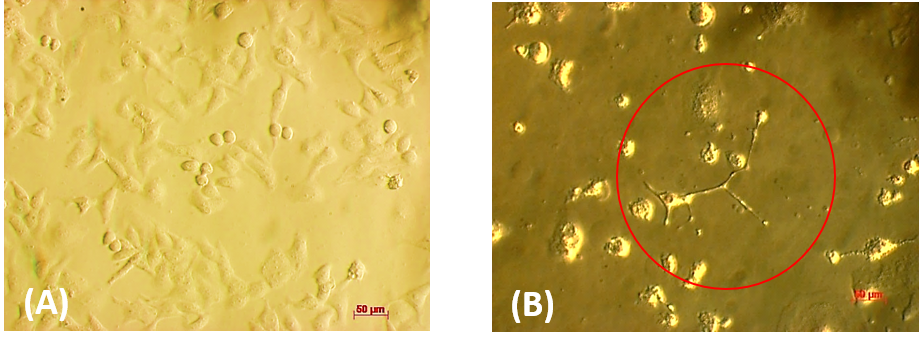
HepG2 cells after being separated will have a uniform round shape, in the form of single cells, and have intact cell membranes ( Figure 1 A ). After 24 hours of culture, the CD133 + HepG2 cells started to attach to the surface of the culture bottle ( Figure 1 B ). After 3 days of culture, from the single CD133 + HepG2 cells, cell proliferation and spread occurred around the surface of the culture flask to form cell clusters. After 7 days of culture, the clusters of cells continued to grow and spread around, giving rise to cells with large sizes and different shapes than the original HepG2 population.
Figure 1 . Cells after isolated by Magnetic method. HepG2 was stained with magnetic CD133-beads and flowthrough the magnetic field to select the CD133 HepG2. ( A ) HepG2 CD133 + after selection by magnetic column, ( B ) HepG2 CD133 + after 24 hours of culturing.

After sorting to select for CD133 + HepG2, cells were cultured in medium for 72 h. The results showed that CD133 + HepG2 cells have a non-homogenous phenotype. Cells showed a robust spreading on the flask surface; the original HepG2 cells have a small round shape compared to the CD133 + HepG2 cells ( Figure 2 ).
Figure 2 . The difference in shape of HepG2 cells before and after of sorting by MACS method. ( A ) HepG2 cells before sorting, ( B ) HepG2 CD133 + after sorting and culturing for 72 hours.

Anti-tumor drug-resistant selection
Before drug treatment, the cells were plated and adhered to create a certain resistance. However, when the drug was added, after a period of stabilization, the groups of cells began to show changes that led to variations in the electrode in different directions ( Figure 3 ). Group 1 (DOX 7 nM, 18 nM, 37 nM)- after 24 hours of DOX treatment- had an increase in cell index over time compared to control samples, proving that DOX (at these concentrations) was not enough to cause lethal effects cells. In other words, cells continued to multiply and adhere normally, resulting in increased resistance. Group 2 (DOX 300 nM, 600 nM) showed a downward trend in the growth curve. The cells after proliferation began to decrease in cell index over time (about 36 hours for DOX 600 nM and 72 hours for DOX 300 nM). This showed that DOX inhibits the cells from performing growth and developmental functions such that they do not adhere to the surface of the culture plate. Group 3 (DOX 150 nM) growth curves fluctuated, similar to Group 2 at the first stage of proliferation, and then cell adhesion was reduced. However, after 72 hours of culture, regrowth of cells was observed, which induced an increase in the resistance value. Therefore, the experiments preliminarily demonstrate that the DOX drug resistance level of HepG2 cells was at 150 nM.
Figure 3 . Doxorubicin growth inhibition curve on HepG2 livercancer cell line by xCELLigence . HepG2 cells were treated with DOX at the concentrations of 600 nM, 300 nM, 150 nM,7 nM, 37 nM, 18 nM and the untreated sample. Cell growth is calculated as the resistance increases as the cell grows and attaches to the electrode of the E-Plate.

The above experiments showed that treatment with DOX at a concentration of 150 nM was most effective. From there, we deduce that isolated and enriched HepG2 populations are resistant to DOX treatment at a concentration of 150 nM. After treatment with 150 nM of DOX, over time the cell morphology changed significantly. On the second day, it was noticed that some cells began to shrink and float in the culture medium ( Figure 4 A). On days 3, 4 and 5, there was an increase of dead cells and the shape of some cells changed ( Figure 4 C, D,E ). Drug-affected HepG2 cells were almost eliminated after environmental change on day 5, leaving the cells with different shapes and with sizes larger than the original HepG2 cells. After 6 days of 150 nM DOX treatment, only abnormally-shaped cells continued to grow and proliferate on the surface of the flasks ( Figure 4 F ).
Figure 4 . HepG2 cells phenotype through the days of treatment with Doxorubicin . HepG2 cells were seeded and cultured for 24 hours. Then cells were treated with Doxorubicin 150 nM. Cells were observed at day 1. HepG2 at day 1 ( A ), 2 ( B ), 3 ( C ), 4 ( D ), 5 ( E ), 6 ( F ).

There is a difference in morphology and size between HepG2 population before and after drug treatment when using doxorubicin (150 nM) to enrich for the population of drug-resistant HepG2 cancer cells. Cells treated with DOX (150 nM) were larger, flatter, and displayed more branching than the cells before treatment ( Figure 5 ).
Figure 5 . The difference of phenotype before and after treatment with Doxorubicin . HepG2 cells were treated with Doxorubicin 150 nM. Then cells were observed at day 1 ( A ) and day 6 ( B )
Spheroid cell culture
HepG2 cells were plated into 96-well Hanging drop plates at a density of 5000 cells /well to create spheroids. After transplanting cells of suitable density, we observed for the formation and growth of cell clusters under reverted microscopy. Initially, the cells seeded onto a hanging drop plate did not have any precipitation and clumping; the cells were in the form of a single cell suspension so they did not form a bond ( Figure 6 A ). After 24 h of culturing cells on a hanging drop plate, under the influence of gravity, cells tended to clump to form a cell array, but the link between cells was still loose. The cell array was easily disrupted by mechanical agents and was not yet fully formed, with single cells still scattered around. E-cadherin is thought to be enhanced or expressed in cells in order to make connections between neighboring cells. After the cells clump and form bonds, they begin to make extracellular matrix proteins and strengthen the bonds between the cells; i.e. extracellular substrates strengthen the structure and increase the compactness of spheroid blocks 16 .
Figure 6 . HepG2 cells in the hanging drop. 5000 cells of HepG2 was added into the well of Hanging drop and culture for 3 days. ( A ) Single cells after seeded into the well of Hanging drop plate. ( B ) Cells aggregates into spheroid after 3 days of culturing.

After 48 h of culture, the shape of the cell mass became clear, the borders began to appear, and the bonds between cells became stronger. After 72 h of modeling, the spheroids began to take on a specific shape, with bold, clear borders and almost no single cells scattered around the sphere ( Figure 6 B).
Evaluation of CD133 marker expression in HepG2 cultured by different methods
Based on the results of FCM analysis, the percentage of CD133 marker expression in CD133 + HepG2 population by the three methods are shown ( Figure 8 , Figure 7 ). In the MACS isolation method, HepG2 cells that were positive for the CD133 marker was found to be a lower percentage (0.63 ± 0.143%). These results show that the separation of CD133 population by MACS method is not highly effective when compared to CD133 + HepG2 population by spheroid method or by enrichment of doxorubicin-resistant drug population (using 150 nM of DOX). In the spheroid method, the CD133+ HepG2 cells accounted for 27.96 ± 2.28% of the population. In the method of enriching the drug-resistant population following treatment with doxorubicin 150 nM, the level of CD133 marker expression was high – at 66.22 ± 4.75%. These results show that the isolation of CD133 population by doxorubicin 150 nM treatment has the highest efficiency, compared to the other two methods .
Figure 7 . HepG2 cells express CD133 by FCM . HepG2 cells from methods of MACS, Spheroids, Doxorubicin enrichment were stained with CD133 antibody and analyzed by flow cytometry.
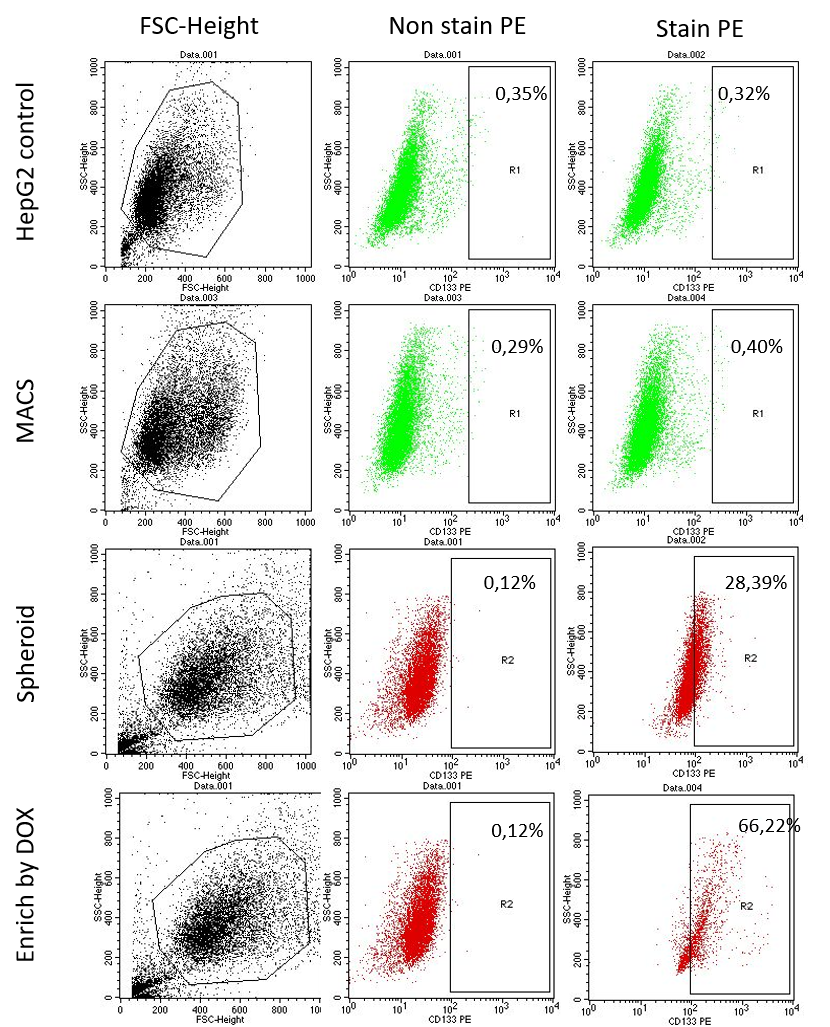
Figure 8 . The percentage of HepG2 positive with CD133. HepG2 that positive with CD133 was isolated by 3 methods MACS, spheroid, enrich. Cells of each method was analyzed by flow cytometry. Data was analyzed by Graphpad Prism. The experiment was replicated n=3.****P<0.000.

Discussion
The theory of cancer stem cells (CSCs) has shown that only a small set of cells in the tumor are able to renew and differentiate into many different cells 17 . Many studies have confirmed that CSCs exist in both hematological and solid tumors 18 . CD133 is a member of the pentaspan membrane protein encoded by the PROM1 gene. It serves as a marker for tumor-initiating cells in certain cancers in humans 19 and, more recently, it has been used to isolate cancer stem cells (CSCs) from liver cell carcinoma (HCC) 20 . Based on previous biological knowledge and research on CSCs, therapies targeting CSCs through CD133 marker expression can be an effective strategy to completely eliminate a tumor for a patient. In this study, CD133 expression cells were isolated from HepG2 hepatocellular carcinoma cell line by three different methods. From there, the level of CD133 marker expression was assessed and analyzed in the isolated population in order to determine which of the 3 isolation methods was most highly effective and pure.
In the MACS method, the CD133 + HepG2 cells could dissociate as single non-adherent cells. After being cultured in DMEM/F12 medium, those CD133 + cells were recorded to be larger in size, to grow into cell clusters, and to have a non-specific shape, compared to the CD133 - populations. These results are similar to the results obtained of the morphology of CD133 + HepG2 cells after separation by MACS method, in a study by X Lan et al. (2012) 21 . However, when evaluating CD133 marker expression in the CD133+ HepG2 cell line by FCM analysis, the results showed that the population of CD133+ HepG2 is low. In a study by Zhu et al. (2010), the proportion of CD133 marker expression cells in HepG2 cells initially was very low compared to other HCC cell lines, specifically according to the analysis results. The percentage of CD133 + cells in HepG2, SMMC-7721, or Huh-7 populations were 0.28 %, 0.10 %, and 65.75 %, respectively 22 . In another study by H Yanli et al. (2014), similar results were obtained when evaluating the level of CD133 + cells in Huh-7 and HepG2 cell lines; the percentages were 18.80 % and 5.20 %, respectively 23 . From these results, it can be seen that the number of cells expressing CD133 marker in the HepG2 cell population is relatively low. Therefore, CD133 + cells derived from HepG2 by MACS is weak and easily affected by external factors. Thus, close monitoring of the cells culture as well as a long culture period, are needed so that the cells can grow.
Many studies have shown that low oxygen concentration (hypoxia) during cancer stem cell culture has been shown to promote CD133 marker expression by adjusting hypoxia-inducible factor 1-alpha (HIF-1α) 25 , 24 . In addition, CSCs have been shown to be present in anoxic zone within the tumor. According to CE Griguer et al. (2008), when studying the level of oxidative stress affecting CD133 marker expression in human glioma cell lines, the results showed that when glial cells are maintained at 21% oxygen during culture, they do not show CD133 marker until the cells were subjected to severe hypoxia (2-3 %). The cells continued to maintain CD133 marker expression as long as they were exposed to low oxygen concentrations 26 . Based on the results of these studies, it can be observed that extended culture of CD133 + HepG2 cells under culture conditions at 37 °C, 5 % CO 2 and and normal level of O 2 may lead to a decrease in CD133 marker expression. Therefore, when analyzing the level of CD133 marker expression by flow, the results were negative.
Cancer stem cells reside in a complex 3D microenvironment and the spheroid 3D model is an indispensable method in tumor biology because they can simulate the microenvironment of tumors and the surrounding structures. According to research by DS Reynols et al. (2017) on MCF-7 breast cancer cells, it was shown that cells in the spheroid core are more resistant to drugs than cells located on the outer edge 27 . The subsequent results also showed that CSC cells were present in the spheroid core at approximately 2:1 ratio, compared to the outer region. In addition, the cell-cell interaction in the spheroid blocks increases the number of CSCs, along with the extent of resistance to chemotherapy, in the core of the sphere 27 .
Our previous study showed that at the density of 5000 cells/well, the size of spheroid blocks increased from day 3 to 4 days in culture. At this time, the process of cell growth and division took place simultaneously with the spheroid compaction. Once the spheroid has been compacted to a certain extent, the proliferation of cells inside the core is inhibited due to lack of nutrients and oxygen, leading to a cessation of growth in size from days 4 to 5. At day 3, there was no sign of a necrotic core in spheroid. Therefore, collecting the spheroid on day 3 with a density of 5000 cells/well will help to collect more CSC cells before the necrotic core forms over the next following days.
In a study by Y Feng et al. (2018), a culture of hanging droplets of HepG2 cells was conducted to create spheres, and then the CD133 + subpopulation was evaluated by FCM analysis 28 . Accordingly, in the study herein, HepG2 cells were grown on hanging drop plates to create a 3D model, and the spheroid was collected after 3 days of culture and evaluated for CD133 marker expression levels by FCM. The analysis results compared the presence of CD133 + cells by 3D culture versus the MACS separation method; our results are similar to the results of Feng et al. (2018) 28 . CD133 marker expression in spheroids is related to the hypothesis that cancer stem cell populations account for a small proportion in cancer cells and in the microenvironment of primary tumors 29 . However, based on the hypothesis and results of the above study, it can be seen that cancer stem cells account for only a small part of the spheroid. Thus, the isolation of CD133 + HepG2 cell population by 3D spheroid method is not high efficacious and the number of CD133 + cells is limited.
In the method of enriching doxorubicin-resistant populations, we rely on one of the characteristics of cancer stem cells is the ability to resist chemotherapy, so that the population can be identified and isolated CSC cells through their ability of resistance to drugs. The result showed that at a concentration of 150 nM doxorubicin, treated HepG2 cells can undergo two processes: (1) mortality of cancer cells impacted by DOX, (2) proliferation of drug-resistant cancer cells after 72 hours of culture. Based on the results obtained, a procedure for isolation and evaluation of drug-resistant cell populations was established based on CD133 marker expression by means of FCM analysis. Numerous studies have demonstrated that CSCs can undergo apoptosis, following cytotoxic drug and radioactive treatment, through a variety of complex mechanisms 30 . CSCs are highly able to express drug-resistant proteins, such as the ABC transporter. CSCs are more capable of repairing DNA damage than normal cancer cells 31 . A recent study by M Chartrain et al. (2012) showed that melanoma cells enriched after temozolomide treatment showed high expression of ABCB5 channels, which increased their anti-cytotoxic properties and stem-like characteristics 32 . According to a study of Cox et al. (2012) on the mechanism of doxorubicin resistance in liver carcinoma cells, it has been shown that in cancer cell populations, there are cells capable of pumping drugs out via the ABC transporter family 33 . These channels need ATP to pump drugs out, protecting cells from toxins. Therefore, increased expression of these transport channels in hepatocellular carcinoma cells is a cause of drug resistance. A number of other studies by Peetla et al. (2013) have shown that membranes of drug-resistant cancer cells have different lipid components compared to other cancer cells in the population 34 . This difference makes the membranes of resistant cells very flexible by changing the fluidity, structure and lipid density. Moreover, combination with many different protein components can thereby reduce permeability of the drug through the membrane. The results in Figure 3 show differences in cell morphology before and after DOX treatment. When the drug is administered, there is a change in the properties of the membrane as well as an increase in the expression of the ABC transporter lines on the membrane, and therefore, some cells will have a larger shape and some cells will shrink. According to a study by Wang et al. (2016), which assessed the multi-drug resistance of a sub-population of prostate cancer cells, the survival rate of cells in the sub-population significantly increased compared to other cancer cells in the population 35 . Another study by CE Griguer et al. (2008) showed that a high proportion of CD133 + cells in U251 glioma cells increased after treatment with doxorubicin and ethidium bromide 26 . Taken together, our study shows that under DOX selection pressure, there is an overexpression of drug-resistant HepG2 cell population positive for the CD133 marker.
Conclusion
Based on the results of CD133 + HepG2 cell isolation and assessment of CD133 marker expression by three cell isolation methods, it can be seen that the enrichment of doxorubicin-resistant population (treated with 150 nM doxorubicin) shows the greater percentage of CD133 + cells than by the other two methods (magnetic-activated cell sorting and spheroid culture).
Abbreviations
MACS : Magnetic-activated cell sorting
DOX : doxorubicin
CSCs : cancer stem cells
FCM : flow cytometry
Acknowledgments
This work was supported by the Vietnam National University, Ho Chi Minh City, Vietnam, under grant A2015-18-01.
Conflict of interest
The authors report no conflicts of interest in this work.
Author Contribution
All authors equally contributed in this work. All authors read and approved the final version of the manuscript for submission.
References
- Lawson JC., Blatch GL., Edkins AL.. Cancer stem cells in breast cancer and metastasis. Breast cancer research and treatment. 2009;118(2):241-254. View Article PubMed Google Scholar
- Al-Hajj M., Wicha MS., Benito-Hernandez A., Morrison SJ., Clarke MF.. Prospective identification of tumorigenic breast cancer cells. Proceedings of the National Academy of Sciences. 2003;100(7):3983-3988. View Article PubMed Google Scholar
- Singh SK., Clarke ID., Terasaki M., Bonn VE., Hawkins C., Squire J., Dirks PB.. Identification of a cancer stem cell in human brain tumors. Cancer research. 2003;63(18):5821-5828. Google Scholar
- Rosen JM., Jordan CT.. The increasing complexity of the cancer stem cell paradigm. Science. 2009;324(5935):1670-1673. View Article PubMed Google Scholar
- Schatton T., Frank NY., Frank MH.. Identification and targeting of cancer stem cells. Bioessays. 2009;31(10):1038-1049. View Article PubMed Google Scholar
- Ginestier C., Hur MH., Charafe-Jauffret E., Monville F., Dutcher J., Brown M., Jacquemier J., P. Viens, Kleer CG., Liu S.. ALDH1 is a marker of normal and malignant human mammary stem cells and a predictor of poor clinical outcome.. Cell stem cell. 2007;1(5):555-567. View Article PubMed Google Scholar
- Morrison R., Schleicher SM., Sun Y., Niermann KJ., Kim S., Spratt DE., Chung CH., Lu B.. Targeting the mechanisms of resistance to chemotherapy and radiotherapy with the cancer stem cell hypothesis. Journal of oncology 2011. 2011;:. View Article PubMed Google Scholar
- A. Suetsugu, Nagaki M., Aoki H., T. Motohashi, Kunisada T., Moriwaki H.. Characterization of CD133+ hepatocellular carcinoma cells as cancer stem/progenitor cells. Biochemical and biophysical research communications. 2006;351(4):820-824. View Article PubMed Google Scholar
- Li J., Chen JN., Zeng T-T., He F., Chen SP., Ma S., Bi J., Zhu XF., Guan X-Y.. CD133+ liver cancer stem cells resist interferon-gamma-induced autophagy.. BMC cancer. 2016;16(1):15. View Article PubMed Google Scholar
- W. Ding, Mouzaki M., You H., JC. Laird, Mato J., Lu SC., Rountree CB.. CD133+ liver cancer stem cells from methionine adenosyl transferase 1A-deficient mice demonstrate resistance to transforming growth factor (TGF)‐β-induced apoptosis. Hepatology. 2009;49(4):1277-1286. View Article PubMed Google Scholar
- Y-L. Chen, P-Y. Lin, Ming Y-Z., Huang W-C., Chen R-F., P-M. Chen, Chu P-Y.. The effects of the location of cancer stem cell marker CD133 on the prognosis of hepatocellular carcinoma patients. BMC cancer. 2017;17(1):474. View Article PubMed Google Scholar
- Fang D., Kim Y., Lee C., Aggarwal S., McKinnon K., Mesmer D., Norton J., Birse C., He T., Ruben S.. Expansion of CD133+ colon cancer cultures retaining stem cell properties to enable cancer stem cell target discovery. British journal of cancer. 2010;102(8):1265-1275. View Article PubMed Google Scholar
- Sheng X., Li Z., Wang D-L., Li W-B., Luo Z., Chen K-H., Cao J-J., Yu C., Liu W-J.. Isolation and enrichment of PC-3 prostate cancer stem-like cells using MACS and serum-free medium. Oncology letters. 2013;5(3):787-792. View Article PubMed Google Scholar
- Wang J., Wu Y., Gao W., Li F., Bo Y., Zhu M., Fu R., Liu Q., Wen S., Wang B:. Identification and characterization of CD133+ CD44+ cancer stem cells from human laryngeal squamous cell carcinoma cell lines. Journal of Cancer. 2017;8(3):497. View Article PubMed Google Scholar
- Huynh V., Ho DH., Nguyen TLX., Nguyen QD.. Separating and culturing colorectal adenocarcinoma cancer cells derived from patients' tumor. Science and Technology Development Journal-Natural Sciences. 2018;2(3):30-35. View Article Google Scholar
- Ponti D., Costa A., Zaffaroni N., Pratesi G., Petrangolini G., Coradini D., Pilotti S., Pierotti MA., Daidone MG.. Isolation and in vitro propagation of tumorigenic breast cancer cells with stem/progenitor cell properties. Cancer research. 2005;65(13):5506-5511. View Article PubMed Google Scholar
- Reya T., Morrison SJ., Clarke MF., Weissman IL.. Stem cells, cancer, and cancer stem cells. Nature. 2001;414(6859):105-111. View Article PubMed Google Scholar
- Bonnet D., Dick JE.. Human acute myeloid leukemia is organized as a hierarchy that originates from a primitive hematopoietic cell. Nature medicine. 1997;3(7):730-737. View Article PubMed Google Scholar
- Mizrak D., Brittan M., Alison M.. CD133: molecule of the moment. The Journal of Pathology: A Journal of the Pathological Society of Great Britain and Ireland. 2008;214(1):3-9. View Article PubMed Google Scholar
- Zhang J., Luo N., Luo Y., Peng Z., Zhang T., Li S.. MicroRNA-150 inhibits human CD133-positive liver cancer stem cells through negative regulation of the transcription factor c-Myb. International journal of oncology. 2012;40(3):747-756. View Article Google Scholar
- Lan X., Wu Y-Z., Wang Y., Wu F-R., Zang CB., Tang C., Cao S., Li S-L.. CD133 silencing inhibits stemness properties and enhances chemoradiosensitivity in CD133-positive liver cancer stem cells. International journal of molecular medicine. 2013;31(2):315-324. View Article PubMed Google Scholar
- Zhu Z., Hao X., Yan M., Yao M., Ge C., Gu J., Li J.. Cancer stem/progenitor cells are highly enriched in CD133+ CD44+ population in hepatocellular carcinoma. International journal of cancer. 2010;126(9):2067-2078. View Article PubMed Google Scholar
- Yanli H., Min T., Xingyue C., Liqun D., Qiangqiang K., Jin S., Shaolin L.. Isolation and identification of CD133-positive liver cancer stem cells and~(131) I-CD133mAb biological effects on the cells. Journal of Third Military Medical University. 2014;(3):11. Google Scholar
- Bussolati B., Moggio A., Collino F., Aghemo G., D'Armento G., Grange C., Camussi G.. Hypoxia modulates the undifferentiated phenotype of human renal inner medullary CD133+ progenitors through Oct4/miR-145 balance. American Journal of Physiology-Renal Physiology. 2012;302(1):F116-F128. View Article PubMed Google Scholar
- Hanahan D., Weinberg RA.. Hallmarks of cancer: the next generation. Cell. 2011;144(5):646-674. View Article PubMed Google Scholar
- Griguer CE., Oliva CR., Gobin E., Marcorelles P., Benos DJ., Jr JR. Lancaster, Gillespie GY.. CD133 is a marker of bioenergetic stress in human glioma.. PloS one. 2008;3(11):. View Article PubMed Google Scholar
- Reynolds DS., Tevis KM., Blessing WA., Colson YL., Zaman MH., Grinstaff MW.. Breast cancer spheroids reveal a differential cancer stem cell response to chemotherapeutic treatment. Scientific reports. 2017;7(1):1-12. View Article PubMed Google Scholar
- Feng Y., Guo X., Huang X., M.Wu Li X., Wu S., Luo X.. Metformin reverses stem cell‑like HepG2 sphere formation and resistance to sorafenib by attenuating epithelial‑mesenchymal transformation. Molecular medicine reports. 2018;18(4):3866-3872. View Article Google Scholar
- Bao B., Ahmad A., Azmi AS., Ali S., Sarkar FH.. Overview of cancer stem cells (CSCs) and mechanisms of their regulation: implications for cancer therapy. Current protocols in pharmacology. 2013;61(1):11-13. View Article PubMed Google Scholar
- Liu G., Yuan X., Zeng Z., Tunici P., Ng H., Abdulkadir IR., Lu L., Irvin D., Black KL., John SY.. Analysis of gene expression and chemoresistance of CD133+ cancer stem cells in glioblastoma. Molecular cancer , 5(1):. PMid:. 2006;5(1):67. View Article PubMed Google Scholar
- Singh A., Settleman J.. EMT, cancer stem cells and drug resistance: an emerging axis of evil in the war on cancer. Oncogene. ;29(34):4741-4751. View Article PubMed Google Scholar
- Chartrain M., Riond J., Stennevin A., Vandenberghe I., Gomes B., Lamant L., Meyer N., Gairin JE., Guilbaud N., Annereau JP.. Melanoma chemotherapy leads to the selection of ABCB5-expressing cells. PloS one. 2012;7(5):. View Article PubMed Google Scholar
- Cox J., Weinman S.. Mechanisms of doxorubicin resistance in hepatocellular carcinoma. Hepatic oncology. 2016;3(1):57-59. View Article PubMed Google Scholar
- Peetla C., Vijayaraghavalu S., Labhasetwar V.. Biophysics of cell membrane lipids in cancer drug resistance: Implications for drug transport and drug delivery with nanoparticles. Advanced drug delivery reviews. 2013;65(13-14):1686-1698. View Article PubMed Google Scholar
- Wang Y-q., Tian H., Yang T-j., Liu L.. Isolation and characterization of multidrug-resistant side population cells in prostate carcinoma. Tropical Journal of Pharmaceutical Research. 2016;15(11):2357-2363. View Article Google Scholar